Activate and Use Xdebug
Xdebug is a powerful open source debugger and profiler for PHP. It is included with XAMPP and can be used to display stack traces, analyze code coverage and profile your PHP code.
To activate Xdebug, follow these steps:
-
Edit the php.ini file in the php\ subdirectory of your XAMPP installation directory (usually, C:\xampp). Within this file, find the [XDebug] section and within it, add the following configuration directive (or modify the existing one):
zend_extension = "C:/xampp/php/ext/php_xdebug.dll"
-
Restart the Apache server using the XAMPP control panel.
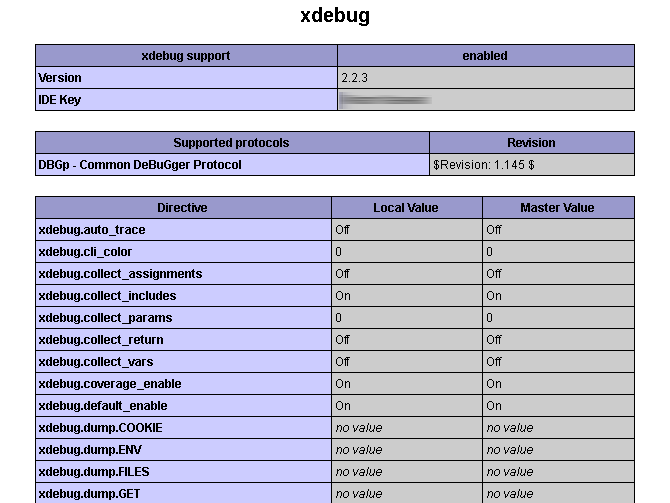
Xdebug should now be active. To verify this, browse to the URL http://localhost/xampp/phpinfo.php, which displays the output of the phpinfo() command. Look through the script and verify that the Xdebug extension is now active.
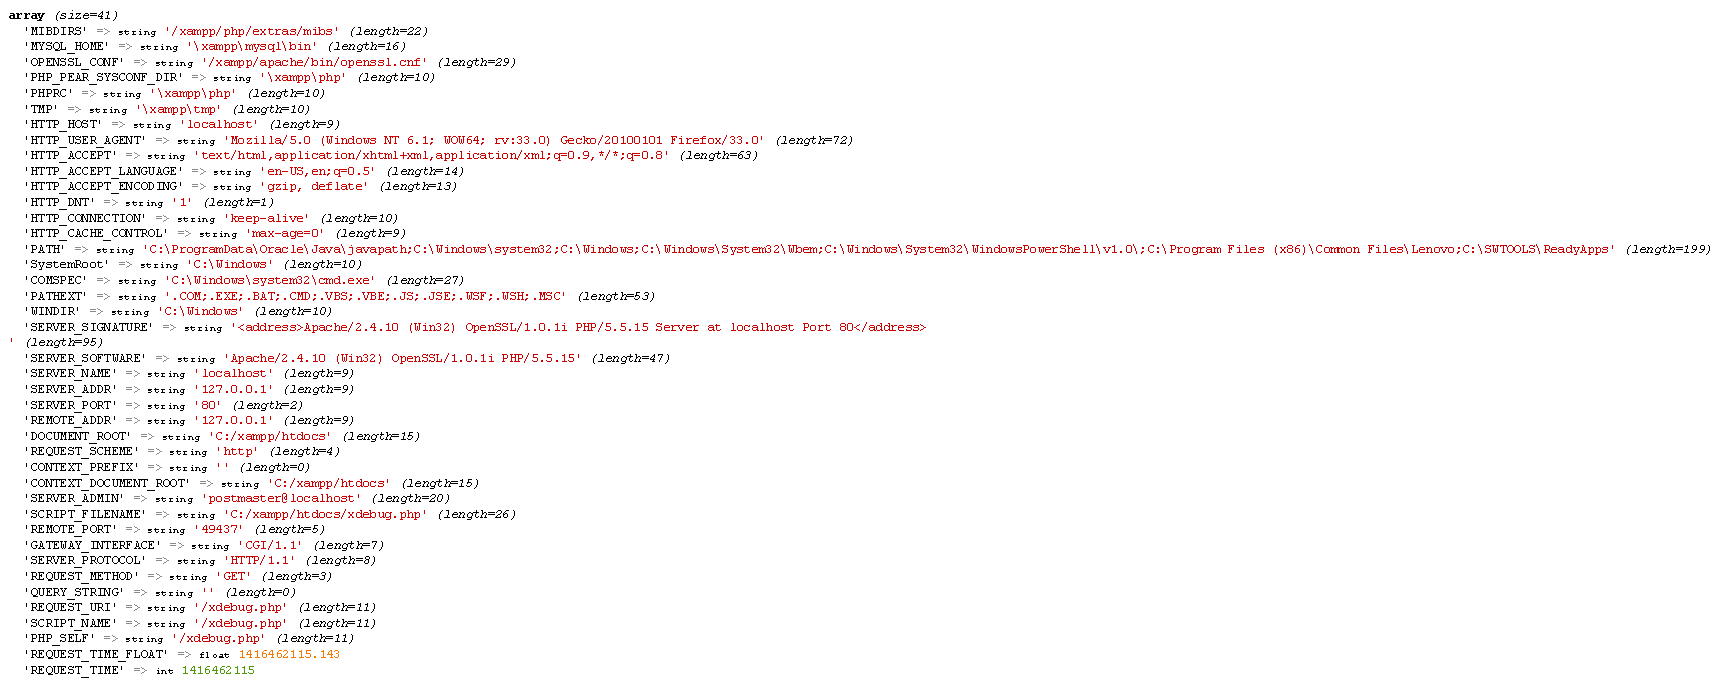
Xdebug overloads the default var_dump() function with its own version that includes (among other things) color coding for different PHP types, so you can see it in action immediately by using the var_dump() function in a PHP script. For example, create a simple PHP script in the htdocs\ subdirectory of your XAMPP installation directory with the following content:
<?php
var_dump($_SERVER);
When you view your script through a browser, here’s an example of what you might see:
One of Xdebug’s most powerful features is its ability to profile a PHP script and produce detailed statistics on how long each function call or line of code takes to execute. This can be very useful for performance analysis of complex scripts. To turn on script profiling, follow these steps:
-
Edit the php.ini file in the php\ subdirectory of your XAMPP installation directory. Within this file, find the [XDebug] section and within it, uncomment and modify the lines below so that they look like this:
xdebug.profiler_append = 0
xdebug.profiler_enable = 1
xdebug.profiler_enable_trigger = 0
xdebug.profiler_output_dir = "C:/xampp/tmp"
xdebug.profiler_output_name = "cachegrind.out.%t-%s"
-
Restart the Apache server using the XAMPP control panel.
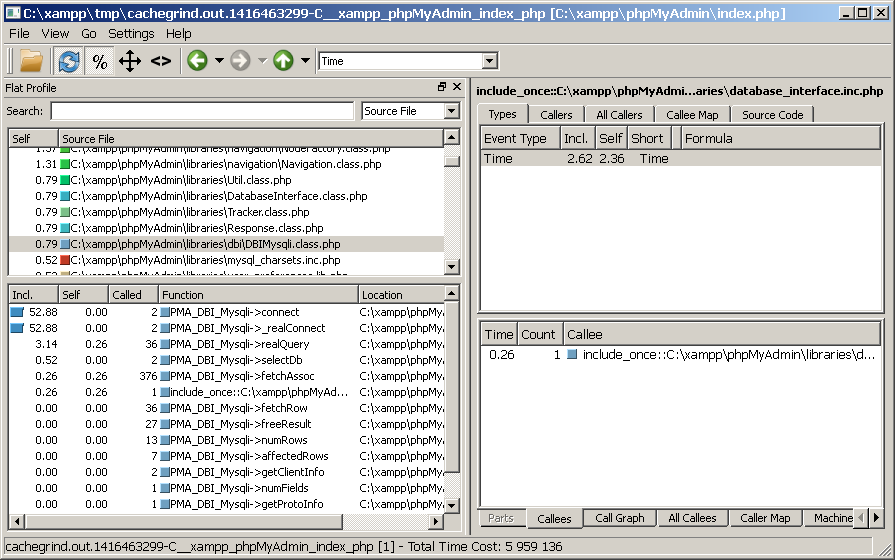
At this point, Xdebug profiling is active. Every PHP script that you run will be profiled and the results will be placed in the C:\xampp\tmp as a so-called cachegrind file. You can view this cachegrind file with a tool like WinCacheGrind, which you must download and install separately.
To illustrate how this works, consider the screenshot below, which shows the profiled output of a script using WinCacheGrind. As the screenshot illustrates, it’s easy to see the entire life cycle of a PHP script, including the call sequence and the amount of time taken by each function, and thereby find targets for further optimization.
| To find out more about Xdebug’s powerful features, read the Xdebug documentation. |